Command Line Interface (CLI)
VisIt 所拥有的 CLI 建立在 Python 2.7 的基础上。
使用 CLI 有如下途径:
在 shell 中启动 VisIt 并运行脚本。
/path/to/visit/bin/visit -nowin -cli -s <script.py>启动 VisIt,以便显示可视化窗口,并以交互方式发布命令。
同时使用标准 GUI 和 CLI。
打开 CLI
从 GUI 打开 CLI:Controls –> Command.
这样就可以打开命令窗口。命令窗口提供了一个文本编辑器,其中 Python 语法高亮显示,并提供了一个 Execute 按钮,告诉 VisIt 执行脚本。最后,命令窗口可以将 GUI 操作记录为可以在脚本中使用的 Python 代码。
简单尝试 CLI
下面是一个简单的例子,绘制数据 temp 的伪色图。
首先在 GUI 中打开数据文件,然后将下面的代码粘贴到命令窗口。
AddPlot("Pseudocolor", "temp")
# You will see the active plots list in the GUI update, since the CLI and GUI communicate.
DrawPlots()
# You should see your plot.
然后 Execute。
脚本示例
以下皆是 Python 脚本,可以通过以上介绍的方式在 VisIt 中运行。
设定属性
VisIt 的绘制和操作都有一系列的属性设置,可以通过 Python 中的对象来控制。
下面是一个设置伪色图最小值和最大值的例子:
DeleteAllPlots()
AddPlot("Pseudocolor", "temp")
DrawPlots()
p = PseudocolorAttributes()
p.minFlag = 1
p.maxFlag = 1
p.min = 3.5
p.max = 7.5
SetPlotOptions(p)
制作等值面动画
DeleteAllPlots()
AddPlot("Pseudocolor", "temp")
iso_atts = IsosurfaceAttributes()
iso_atts.contourMethod = iso_atts.Value
iso_atts.variable = "temp"
AddOperator("Isosurface")
DrawPlots()
for i in range(30):
   iso_atts.contourValue = (2 + 0.1*i)
   SetOperatorOptions(iso_atts)
   # For moviemaking, you'll need to save off the image
   # SaveWindow()
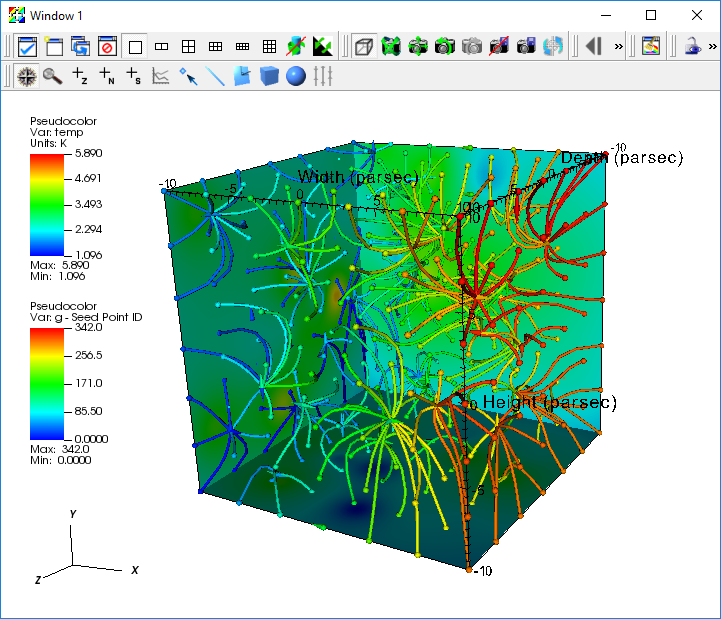
一个综合应用
下面使用伪彩色图,并应用 ThreeSlice 运算符在网格外部显示 temp 以及温度梯度的流线。

# Clear any previous plots
DeleteAllPlots()
# Create a plot of the scalar field 'temp'
AddPlot("Pseudocolor","temp")
# Slice the volume to show only three
# external faces.
AddOperator("ThreeSlice")
tatts = ThreeSliceAttributes()
tatts.x = -10
tatts.y = -10
tatts.z = -10
SetOperatorOptions(tatts)
DrawPlots()
# Find the maximum value of the field 'temp'
Query("Max")
val = GetQueryOutputValue()
print "Max value of 'temp' = ", val

# Create a streamline plot that follows
# the gradient of 'temp'
DefineVectorExpression("g","gradient(temp)")
AddPlot("Pseudocolor", "operators/IntegralCurve/g")
iatts = IntegralCurveAttributes()
iatts.sourceType = iatts.SpecifiedBox
iatts.sampleDensity0 = 7
iatts.sampleDensity1 = 7
iatts.sampleDensity2 = 7
iatts.dataValue = iatts.SeedPointID
iatts.integrationType = iatts.DormandPrince
iatts.issueStiffnessWarnings = 0
iatts.issueCriticalPointsWarnings = 0
SetOperatorOptions(iatts)

# set style of streamlines
patts = PseudocolorAttributes()
patts.lineType = patts.Tube
patts.tailStyle = patts.Spheres
patts.headStyle = patts.Cones
patts.endPointRadiusBBox = 0.01
SetPlotOptions(patts)

DrawPlots()
创建流线动画
需要安装 ffmpeg 且在工作环境下可用。
# import visit_utils, we will use it to help encode our movie
from visit_utils import *

# Set a better view
ResetView()
v = GetView3D()
v.RotateAxis(0,44)
v.RotateAxis(1,-23)
SetView3D(v)

# Disable annotations
aatts = AnnotationAttributes()
aatts.axes3D.visible = 0
aatts.axes3D.triadFlag = 0
aatts.axes3D.bboxFlag = 0
aatts.userInfoFlag = 0
aatts.databaseInfoFlag = 0
aatts.legendInfoFlag = 0
SetAnnotationAttributes(aatts)

# Set basic save options
swatts = SaveWindowAttributes()
#
# The 'family' option controls if visit automatically adds a frame number to
# the rendered files. For this example we will explicitly manage the output name.
#
swatts.family = 0
#
# select PNG as the output file format
#
swatts.format = swatts.PNG
#
# set the width of the output image
#
swatts.width = 1024
#
# set the height of the output image
#
swatts.height = 1024


####
# Crop streamlines to render them at increasing time values over 50 steps
####
iatts.cropValue = iatts.Time
iatts.cropEndFlag = 1
iatts.cropBeginFlag = 1
iatts.cropBegin = 0
for ts in range(0,50):
    # set the integral curve attributes to change the where we crop the streamlines
    iatts.cropEnd = (ts + 1) * .5

    # update streamline attributes and draw the plot
    SetOperatorOptions(iatts)
    DrawPlots()
    #before we render the result, explicitly set the filename for this render
    swatts.fileName = "streamline_crop_example_%04d.png" % ts
    SetSaveWindowAttributes(swatts)
    # render the image to a PNG file
    SaveWindow()

################
# use visit_utils.encoding to encode these images into a "wmv" movie
#
# The encoder looks for a printf style pattern in the input path to identify the frames of the movie.
# The frame numbers need to start at 0.
#
# The encoder selects a set of decent encoding settings based on the extension of the
# the output movie file (second argument). In this case we will create a "wmv" file.
#
# Other supported options include ".mpg", ".mov".
#   "wmv" is usually the best choice and plays on all most all platforms (Linux ,OSX, Windows).
#   "mpg" is lower quality, but should play on any platform.
#
# 'fdup' controls the number of times each frame is duplicated.
#  Duplicating the frames allows you to slow the pace of the movie to something reasonable.
#
################

input_pattern = "streamline_crop_example_%04d.png"
output_movie = "streamline_crop_example.wmv"
encoding.encode(input_pattern,output_movie,fdup=4)
学习 CLI
可以通过以下命令得到可用命令表
echo "dir()" | visit -cli -nowin -forceinteractivecli | tr ',' '\n' | tr -d " '" | sort如果想寻找与特定功能有关的 CLI 功能
echo "dir()" | visit -cli -nowin -forceinteractivecli | tr ',' '\n' | tr -d " '" | grep -i material通过键入 help(MethodName) 来学习特定方法的语法
可以把 GUI 中的操作转录为 Python 脚本
WriteScript() 函数可以把当前的绘制转录为 Python 脚本
对一个 Python 对象,可通过 print 来看它的属性
s = SliceAttributes() print s # Output: originType = Intercept # Point, Intercept, Percent, Zone, Node originPoint = (0, 0, 0) originIntercept = 0 originPercent = 0 originZone = 0 originNode = 0 normal = (0, -1, 0) axisType = YAxis # XAxis, YAxis, ZAxis, Arbitrary, ThetaPhi upAxis = (0, 0, 1) project2d = 1 interactive = 1 flip = 0 originZoneDomain = 0 originNodeDomain = 0 meshName = "default" theta = 0 phi = 0更多内容可以参看官方手册。

